
 If you would like to catch up with the first part of this discussion read this.
So, hitters and pitchers each earn half the fantasy value in a league, but on auction day we pay the hitters close to 70 percent of the money and pitchers a tad more than 30 percent.
One reason is because many pitchers we buy in the auction turn out not to be the best pitchers to have taken. Last year half the pitchers paid real money in the auction earned a negative value at the end of the season. Contrast this with hitters, of whom only 22 percent went south.
We talked about a few reasons for the discrepancy, including the fact that Pitchers are measured by two Qualitative numbers (ERA and WHIP) while Hitters are measured by only one (BA), and also the fact that ERA and WHIP are linked and that individual pitchers by the nature of their roles are always dumping at least one category (Saves for starters, W and K for relievers), but those facts don’t keep the best pitchers from earning big boy bucks. Clayton Kershaw earned as much last year as Mike Trout, but on draft day they won’t be paid the same.
The knee jerk reaction is to say that this is because we don’t do as good a job at projecting pitchers, or that pitchers get hurt and so fail catastrophically more than hitters do, but while those effects factor into our individual experiences from year to year, they aren’t really true. At least not for the best pitchers.
Last year fantasy teams bought 76 hitters for $20 or more in auction, paying $2098. Those players earned $1749, a loss of 17 percent.
Meanwhile, 18 pitchers were paid $20 or more in the auction, costing $468, and they earned $417, a loss of 11 percent.
(Note: In my first pass I focused on a similarly elite percentage of the hitter pool as the pitching pool, but the loss rate among elite hitters last year was much higher than that of this broader group. I changed to $20+ because that seemed like a fair indicator of a player in whom a sizeable investment has been made by a fantasy team. In any case, the point is that the elite pitchers offer a comparable value to the bulk of trusted hitting talent, and that point isn’t undermined in any way by the difference in population sizes.)
I think it’s safe to say based on this one year of data that the top pitchers are as reliable as the top hitters. Obviously we’ll learn more as I clean up more years of data, and there may be outlier years where the return deviates wildly, but there’s no way to look at last year (when the most expensive starting pitcher in the game earned $6) and see it as exceptionally rosy. I’ve done similar studies many times in the past and the results always fall this way. The top pitchers as a group compare well with the hitters.
Which raises the question, why don’t we pay more for them? Especially since the other pitching cohorts are a disaster.
The pitchers who were paid from $10-19 cost $888 and returned $359, a loss rate of 60 percent.
And the pitchers who were paid from $1-9 cost $506 and actually lost $184, for a loss rate of negative 36 percent.
So, if the pitching discount was based on reliability and projectability, why wouldn’t we load up as best could on the expensive pitchers, since they’re the most reliable?
The answer, I think, stems from another bit of data. Here it is from last year.
For the hitters, for whom $4355 was paid on draft day, the value of the unbought on draft day players who earned positive amounts was $215. Alex Patton has long called the stats acquired after the auction, from waivers and FAABing, as Free Loot. It doesn’t cost you anything, at least not from your original $260. Free loot for hitters is about five percent of the budget.
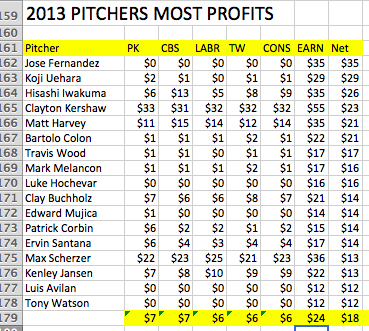
For the pitchers, for whom the expert leagues last year paid $1855, the free loot was $468, or 25 percent of the budget. That’s a lot of free loot. Hello Jose Fernandez!
And the free loot doesn’t even count the dough earned by guys like Bartolo Colon, who cost a dollar but paid off big. The mostly random distribution of these cheap surprises dilutes the value of the known quantities. If there is so much milk out there you can have for free, why buy the cow? If you know what I mean. This chart gives you an idea of how this broke last year:
So, while there may well be small influences from any number of factors, the unique and larger drivers of this hitting/pitching split seem to be linked directly to the unequal distribution of the free loot, coupled with the greater volatility of pitching performance (and the way we measure it in fantasy).
Lest you think I invented this, as if anything can ever be new, let me close with a reference to Les Leopold, from the 1996 edition of How To Win at Rotisserie Baseball.
Les took the average draft day standings for 30 teams that uber-stat service operator Jerry Heath compiled each year to establish category norms for roto, and compared them with average end of the year stats for those leagues to show how much free loot there was available, category by category, by the end of the year. Les found for the categories that roto counted back then:
Category (Available extra stats teams collected)
HR (5 percent)
RBI (6 percent)
Saves (6 percent)
SB (7 percent)
AB (9 percent)
H (9 percent)
Wins (20 percent)
Innings (20 percent)
WHIP (20 percent)
ERA (21 percent)
I’m working on a piece for the Tout Wars website that looks at last year’s NL auction from the perspective of free loot, which I expect will show that not much has changed since the mid-90s except that we play 5×5 (or more) now.
And look for more here in the coming days about player values and practical ways to use them.


Pingback: What Is The Ideal Spending Allocation Between Pitchers and Hitters? | Smart Fantasy Baseball
Pingback: Analyzing the Last Five Years of Rotisserie Baseball Drafts | Smart Fantasy Baseball
Pingback: Hitter/Pitcher Split: A lesser known secret of player valuation and ranking | Harper Wallbanger